Database Performance Monitoring for SQL Server, Azure SQL Database, and Amazon RDS for SQL Server
Free Tool – SQL Check
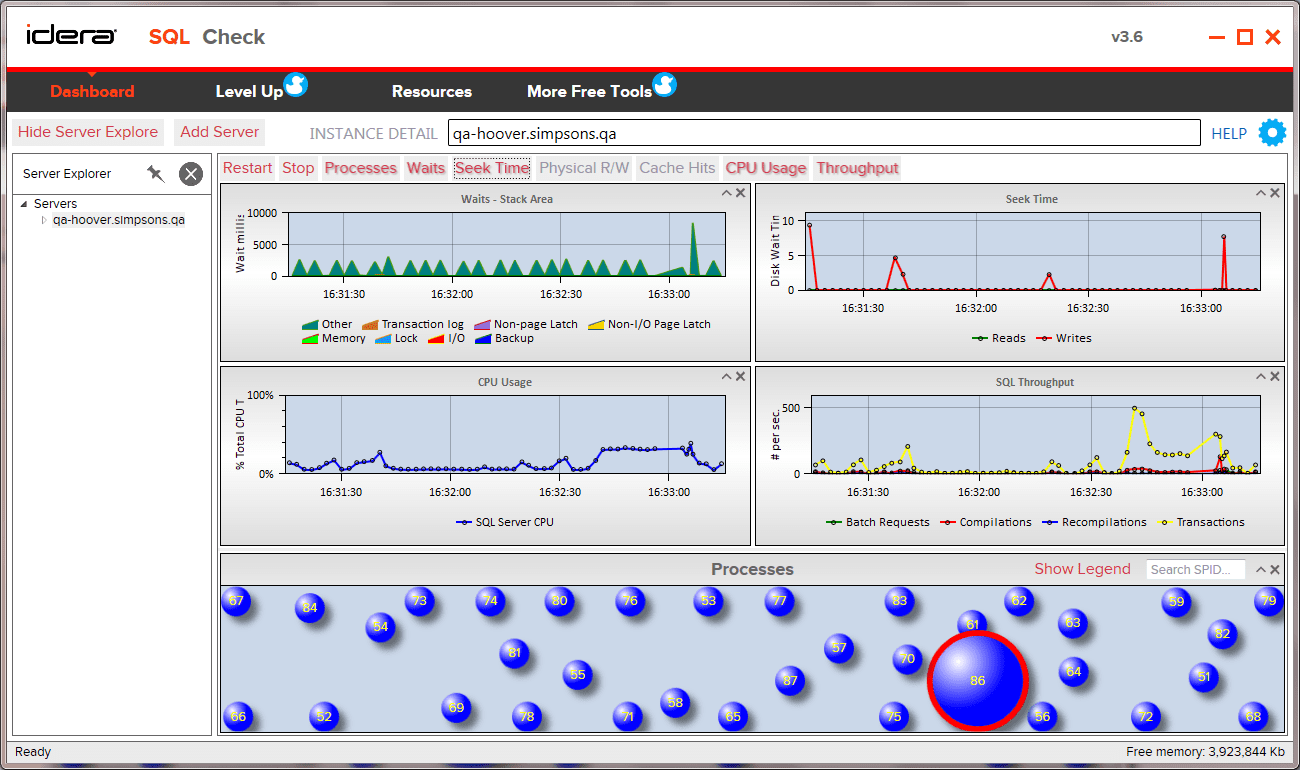
Watch key performance metrics in real-time
Monitoring key performance metrics is vital in ensuring optimal database performance as it facilitates proactive management of data systems, leading to improved efficiency, reliability, and system health. By continuously tracking these metrics, including response times, usage statistics, query execution times, among others, potential performance-related issues, bottlenecks, and slowdowns can be identified and resolved promptly. This consistent monitoring not only helps maintain system performance but also guards against data loss, enhances disaster recovery capabilities, and ensures service continuity. Ultimately, it supports informed, data-driven decision-making to optimize system resources, improve user experience, and minimize downtime, thus contributing to an organization’s productivity and success.SQL Check monitors database performance for SQL Server, Azure SQL Database, and Amazon RDS for SQL Server. It helps you to:
- Monitor in real-time database performance with an intuitive and customizable dashboard.
- Identify issues by displaying key metrics in time series charts.
- Discover the bottlenecks that slow down your performance.
- Resolve problems fast by drilling down into details for quick diagnostics.
- Deploy the free tool without installing anything on the monitored database instances.”.
What is New in SQL Check 3.7:
The release of SQL Check version 3.7 in 2024 focuses on addressing numerous customers submitted suggestions and adding quality enhancements to the application:
- Connecting to instances via Azure Active Directory to supplement SQL Authentication and Windows Active Directory
- Displaying the graphical user interface properly at different screen sizes and for all high resolution monitors
- Better usability of the application by refining and reinforcing its overall functionality
- Bug fixes
Monitor Key Performance Metrics
Connect to a SQL Server instance and display the most important metrics for performance in dedicated charts on a convenient dashboard. Hover over the displayed data to view details.
See Throughput of Varying Types
Display important metrics such as wait stats, reads, writes, session details, and cache hits. Check out what happens in batches, compilations, recompilations, and transactions so you do not experience any surprises and know where to direct your attention to prevent potential issues.
See Heartbeat Statistics at Different Intervals
Monitor the performance like a heart rate monitor for your SQL Server environment. Customize the refresh rate and amount of historical data for each SQL Server instance.
Get Up and Running in Minutes
Quickly get up and running within minutes using the setup wizard to guide you through the install process. With the intuitive graphical user interface of the application, easily register SQL Server instances and start displaying real-time metrics.
No Agents Required on Monitored Instances
Installing agents on SQL Server instances can be tedious and invasive. And agents installed on monitored SQL Server instances can impact performance. SQL Check does not require installing an agent on the monitored instances.
Connect to the Cloud and Run in the Cloud
Connect to database instances hosted on cloud virtual machines, such as SQL Server on Azure Virtual Machine (VM) and SQL Server on Amazon Elastic Compute Cloud (EC2).
Connect to the managed cloud databases Azure SQL Database and Amazon Relational Database Service (RDS) for SQL Server.
Install and run on virtual machines hosted in the cloud, such as Windows on Azure Virtual Machine (VM) and Windows on Amazon Elastic Compute Cloud (EC2).
SQL Check

