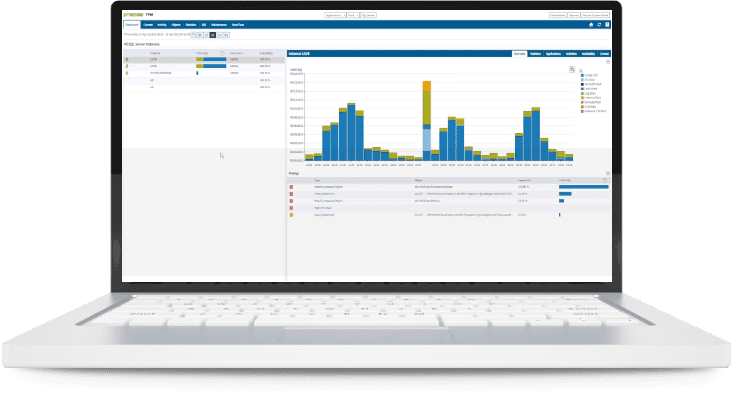
Application Transaction Performance Monitoring for Microsoft .NET
Precise for .NET
Track the performance of .NET application transactions including SharePoint

- Track the performance of application transactions
- Proactively find and fix transaction performance problems
- Ensure application and database availability for end-users


Support end-to-end .NET tiers
Monitor SharePoint applications, .NET, Internet Information Services (IIS), and SQL Server. For each of these tiers, the interface of Precise looks and behaves the same to minimize the learning curve.

Sample continuously and frequently with low overhead
Precise for .NET samples the monitored applications once per second or more frequently. It has low overhead (typically 1%), and it is non-intrusive. It provides access via a web-based console, and it is safe for production environments.


View findings
See where transactions spend the majority of the time within the different tiers. View top consuming transactions. Drill down into the top findings to efficiently analyze and diagnose performance issues and to view expert recommendations.

Tune SQL Server databases
Tune database objects when it is not possible to change the text of the application transactions that access the objects by examining how well the active objects perform.


Contribute to DevOps
Extend to Precise for .NET to watch the end-to-end technology stack of other common applications technologies (such as web and Java). Focus on tracking transactions deep into databases.

- Support multiple .NET tiers
Monitor SharePoint applications, .NET, Internet Information Services (IIS), and SQL Server from a single tool. - Collect transactions continuously
Track transactions non-stop to avoid missing performance problems and trends. - Sample data frequently
Get a real-time view of the database environment with a high granularity as fast as 1 second or more frequently. - Correlate to application context
Correlate transactions with users, databases, devices, files, and accessed objects for proper context.
- Find root cause of performance issues
From the overview dashboard, dive deep into the details of the transactions to isolate problems quickly. - View full infrastructure path
Combine the application context and performance details to track queries through the infrastructure. - Resolve locks and latches
Identify real-time and historical locks and latches and view the entire blocking chain for a fast resolution.
- Get tuning recommendations
View expert tuning advice that is proactive and actionable to improve statements, objects, and indexes. - Simulate what-if scenarios
Perform what-if analysis to predict the potential impact of proposed changes on other transactions. - Tune performance smartly
The SmarTune process detects performance deterioration by regularly analyzing performance data.
- Use a single, merged, web-based console
Access the dashboard in the web-based console from any web browser for easy deployment. - Manage environments via federation
Monitor the entire .NET environment remotely from a single, dedicated framework machine. - Expose monitored databases to low impact
Precise is agentless and installs nothing (such as services and objects) on production systems. - Deploy a simple architecture
Reduce the footprint, simplify installations and upgrades, and eliminate the risk for production systems.
- Install on cloud virtual machines
Install and run Precise for .NET on cloud virtual machines such as Amazon EC2 and Azure VM. - Monitor .NET on cloud virtual machines
Monitor SharePoint applications, .NET, Internet Information Services (IIS), and SQL Server running on cloud virtual machines such as Amazon EC2 and Azure VM. - Manage hybrid environments with a single tool
Save time by using the same tool on-premises and in the cloud to minimize the learning curve. - Connect to managed SQL Server cloud databases
Extend the cloud capabilities by monitoring the database-as-a-service Amazon RDS for SQL Server and Microsoft Azure SQL Database.
