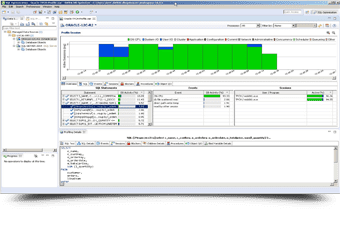
Multi-Platform Tuning Interface
Automate SQL tuning across all major relational database platforms (Microsoft SQL Server, Oracle Database, IBM Db2 LUW, SAP Sybase ASE, PostgreSQL, Pivotal Greenplum, and Amazon Redshift) from a single common graphical user interface. interface. And use the tool on all supported platforms from a single license. Streamline and automate common and repetitive tasks with an easy-to use GUI and powerful wizards.
SQL Rewrites & Case Generation
SQL rewrites are suggested as part of the case generation in the SQL tuner as well as when you type in the SQL IDE. SQL rewrites and hint injection are used to generate cases and find the best alternative to a given SQL statement.
Hint Injection
Customize the subset of hints to be considered for hint injection and alternative execution paths.
Explain Plan Cost
View the explain plan cost for each original statement and each generated case to give the user the expected cost given the execution path utilized by the database.
Visual SQL Tuning
The Visual SQL Tuning (VST) diagram displays indexes and constraints on tables and views as well as the joins used in a SQL statement such as Cartesian joins, implied Cartesian joins and many-to-many relationships, with table statistics.
Index Analysis
The color-coded Index Analysis feature shows indexes that are used (green), not used (blue) or missing (orange) and offers indexing recommendations for optimum performance.
Execution Statistics
Run the SQL with alternative execution paths to discover the fastest running SQL statement, and apply the change at the click of a button.
Textual Comparison of Cases
A visual difference viewer helps the user spot the textual differences between any two SQL statements.
Sampling
Identify and diagnose performance bottlenecks and problematic SQL without agents or placing a significant load on the target database.
Load Editor
SQL stress testing simulates a number of parallel users and executions over a specific period of time or execution cycle.
Continuous Profiling
Continuously profile an entire data source within a configurable span of time.
Profiling a Stored Routine
When fine tuning or testing SQL, profile the execution of a single stored routine when profiling an entire data source is not desired.
Live Data
Show data in real-time while profiling is in progress.
Sharing Profile Sessions
All data and metadata pertaining to a profile session can be saved as a single entity into an archive file. Profiles can be shared across multiple workspaces and machines for collaboration purposes.
Profile Chart
View the CPU, I/O, and other wait activity over the course of the session. Zoom in/out functionality available.
Execution Statistics
Detailed information on the profiled SQL and wait categories, broken down by SQL statements, events, and sessions.
Profiling Details
Drill down into the execution details for any given statement, including the SQL text, events, sessions, child cursors, blockers, procedures, and SQL details.
Predicate Analysis
SQL statements are rolled up for a true analysis of the number of executions in real-time.
Explain Plans
The Explain Plan for each SQL statement can be computed on demand via a context menu item in the Execution Statistics table. The Explain Plan appears in a separate view as a tree with columns and collapsible column groups.
Cropping
Highlights a time interval in the profile chart to instantly change the data displayed, making it easier to see the details.
Repository Capture
Stream profiling data into a central repository for your open session.
File Capture
Save an entire profiling session to a file for future analysis and reference or to share with other teams in the organization.
Command Line API
Launch profiling and tuning sessions remotely.
Unicode Support
Full Unicode character support throughout the application.
Buy Now
Starts at $715.00 $572.00 per user (workstation)
Save at least 20% on all online purchases.
Volume discounts available.
