IT Infrastructure Performance Monitoring
Uptime Infrastructure Monitor
Multi-Platform Server Monitoring
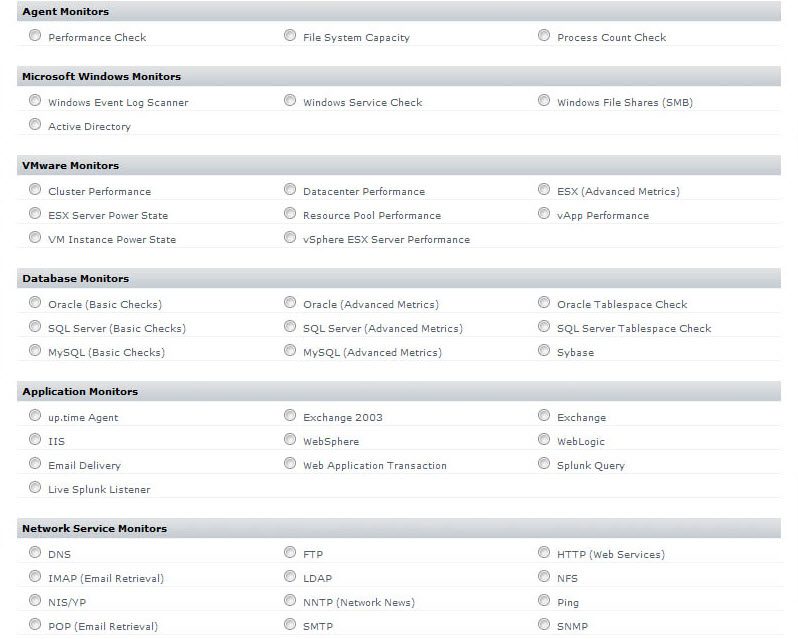
Uptime Infrastructure Monitor is comprehensive server monitoring software that gives you a unified and accurate view of your servers’ health, including deep metrics on performance, availability, and capacity that are collected and preserved for reporting. Monitor and report across one or many platforms at once, including Windows, Linux, UNIX (AIX, Solaris, HP-UX, Novell), and Virtual (VMware, Hyper-V, Xen) servers running on-premise, remotely, or in the Cloud.
Virtual Monitoring
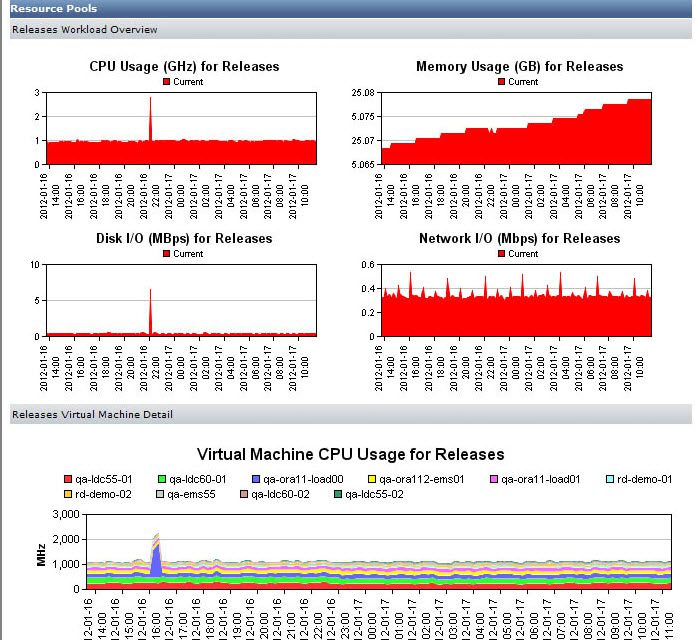
Monitor performance and availability across your virtual platforms to ensure your virtual servers, applications and services are running smoothly. Monitor VMware (vCenter, vSphere, ESX, ESXi, workloads, clusters, vApps, resource pools, etc.), Hyper-V (hosts and guest VMs) and its checkpoints (snapshots), Xen, Solaris (Zones, Containers), and AIX (LPARS). Monitor your entire virtual stack, including applications, clusters and hosts, resource pools, virtual networks, and storage. Analyze workloads for the entire virtual data center. Determine underused or abandoned VMs, and track VM net growth and sprawl.
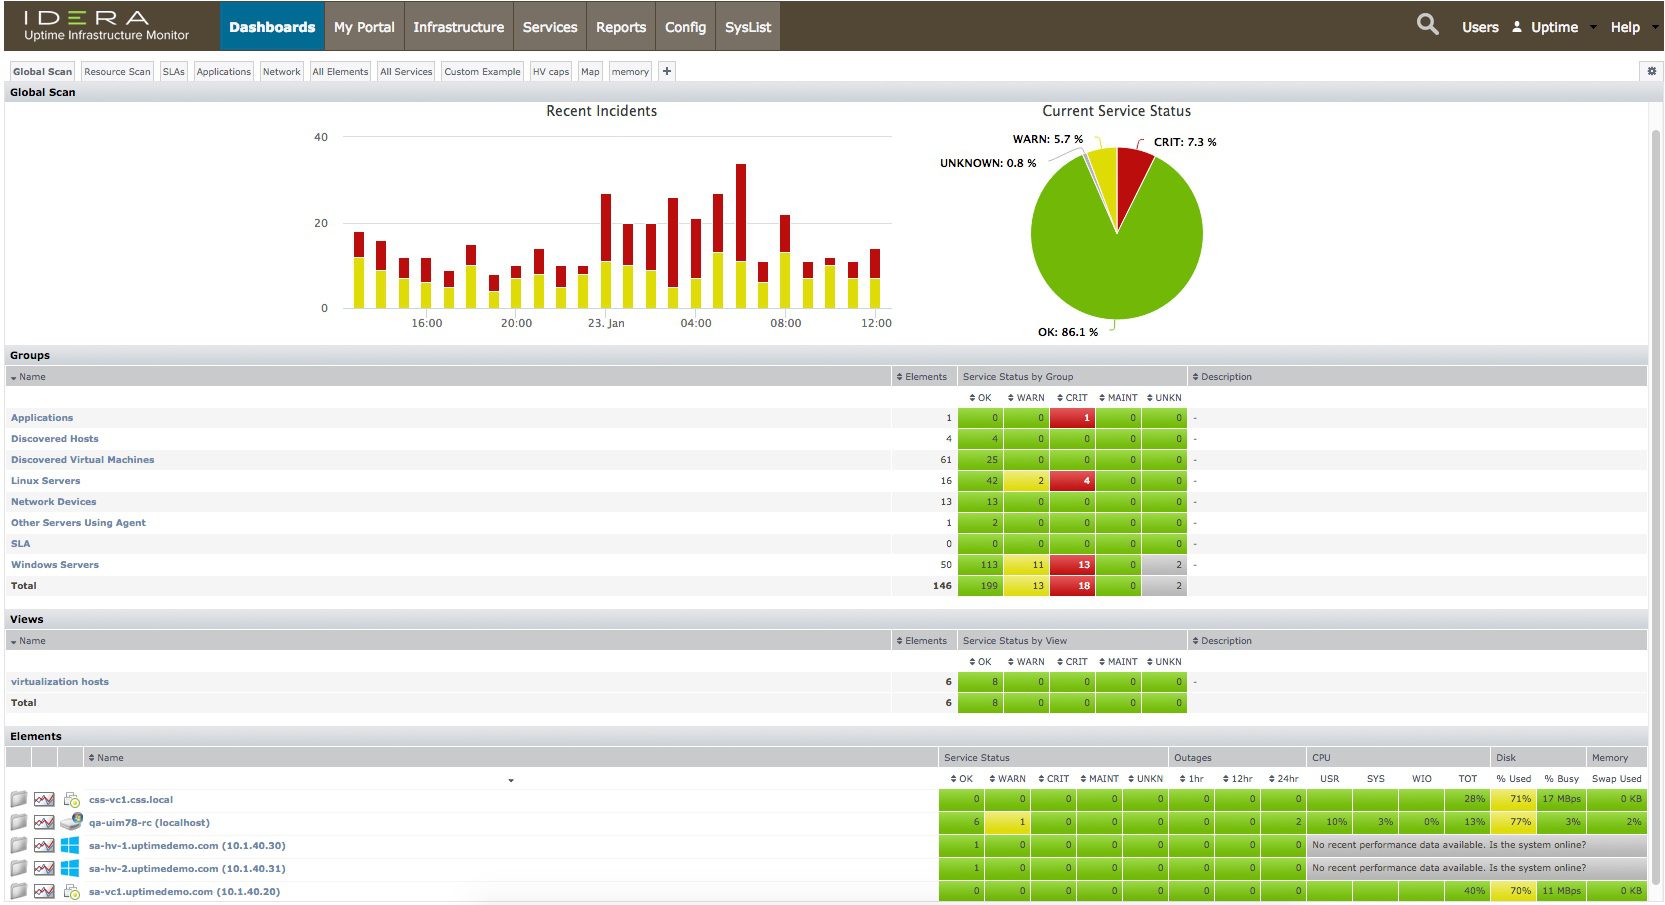
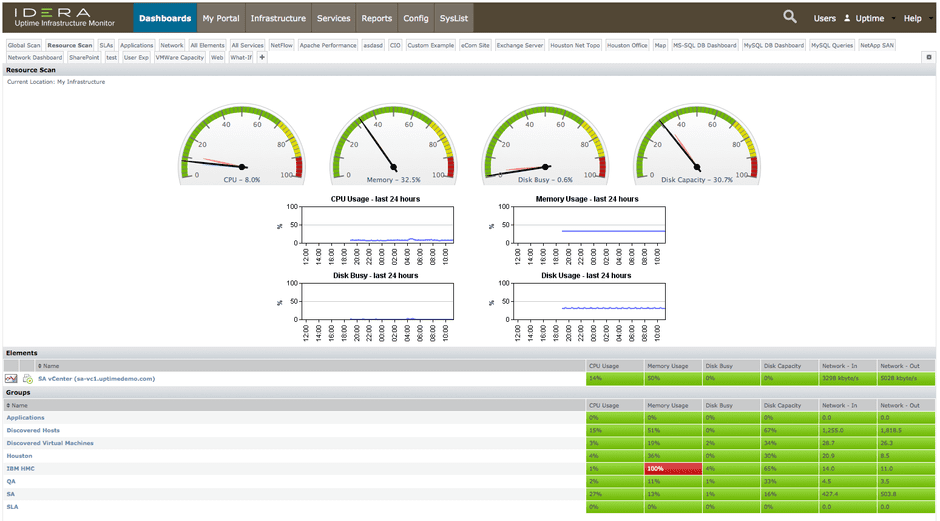
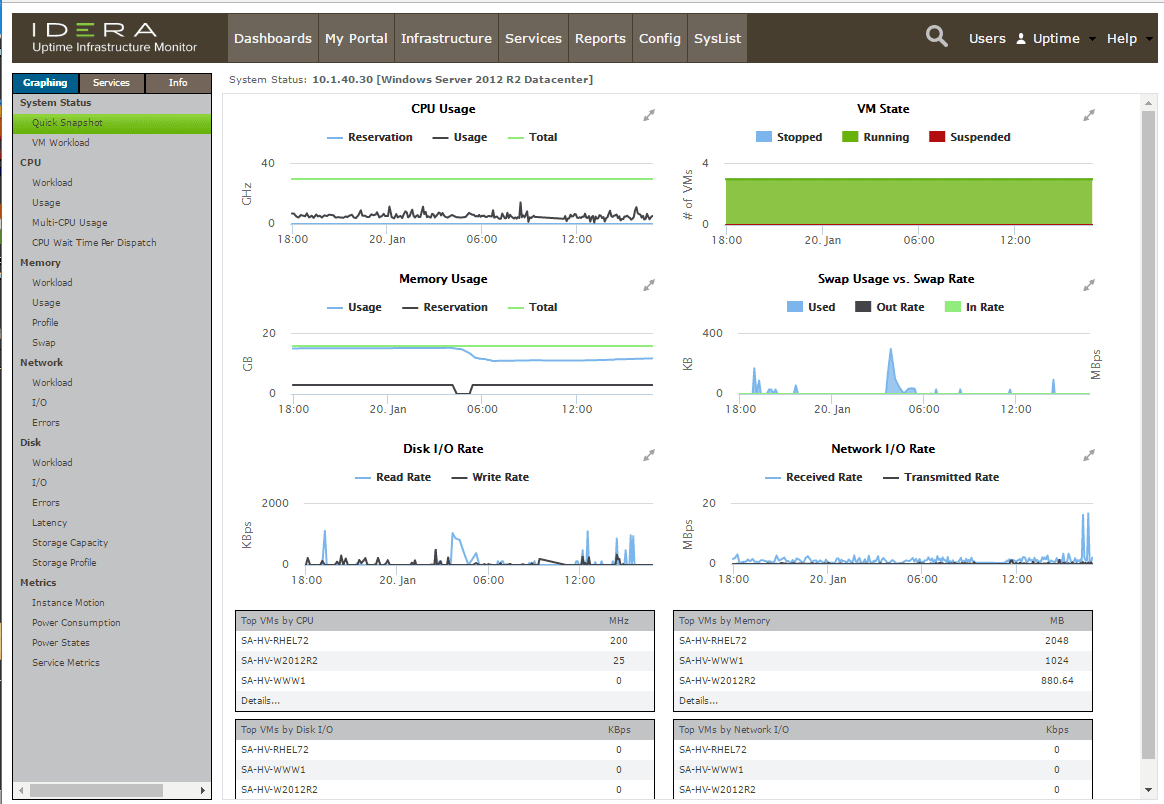
Customizable Server Dashboards
Uptime Infrastructure Monitor’s server monitoring dashboards show complete server health, including server performance, server availability, and server capacity across all the server platforms you use. Uptime Infrastructure Monitor’s GUI is easily customizable, with a drag and drop dashboard design. In minutes, create private dashboards, role-based dashboards, and team dashboards (Windows group, UNIX group, VMware group, application team, capacity team, etc.). Do you need an network operations center (NOC) (that is, a UI-free, full-screen, slideshow-style view of multiple dashboards) for the entire datacenter? Set one up in under 5 minutes.
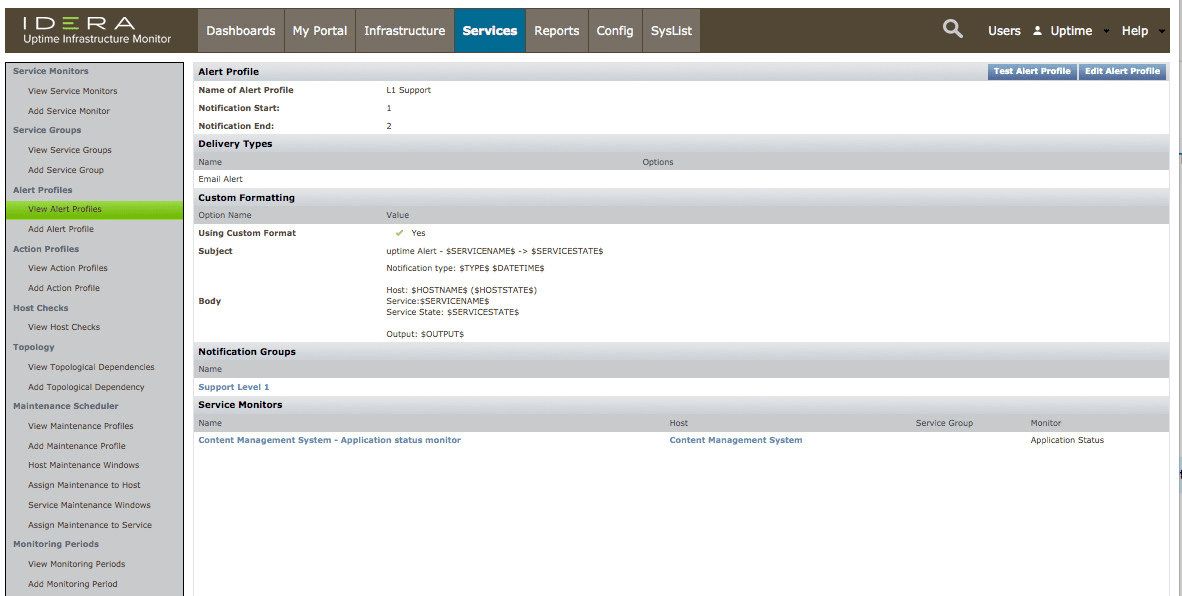
Proactive Server Alerts and Root Cause Analysis
From initial alert to root cause analysis and self-healing automation, Uptime Infrastructure Monitor has your servers covered. Always get the right alert at the right time, with no false alerts that leave you guessing what the real problem is. Alert on the state of an application as a whole rather than getting several individual alerts with detailed information as to what led to that application being in an alert state (for example, SharePoint is in the warning state because the team site cannot be loaded or Active Directory / LDAP is unavailable). Dive into Uptime Infrastructure Monitor’s customizable and interactive server monitoring dashboards and go from high-level views (like world maps, topology and dependency maps, and more) to root-cause in minutes. Uptime Infrastructure Monitor’s deep server monitors and server metrics show you exactly where the problem is, regardless if it’s at the server, network, or application level.
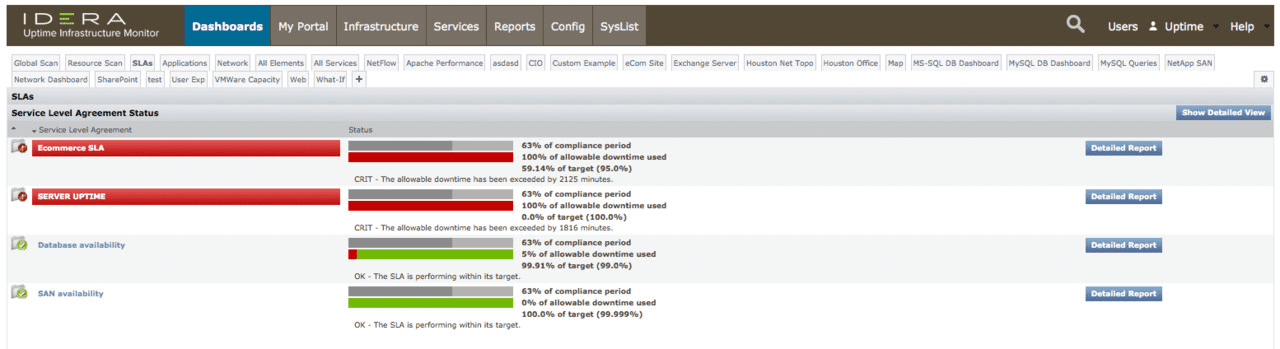
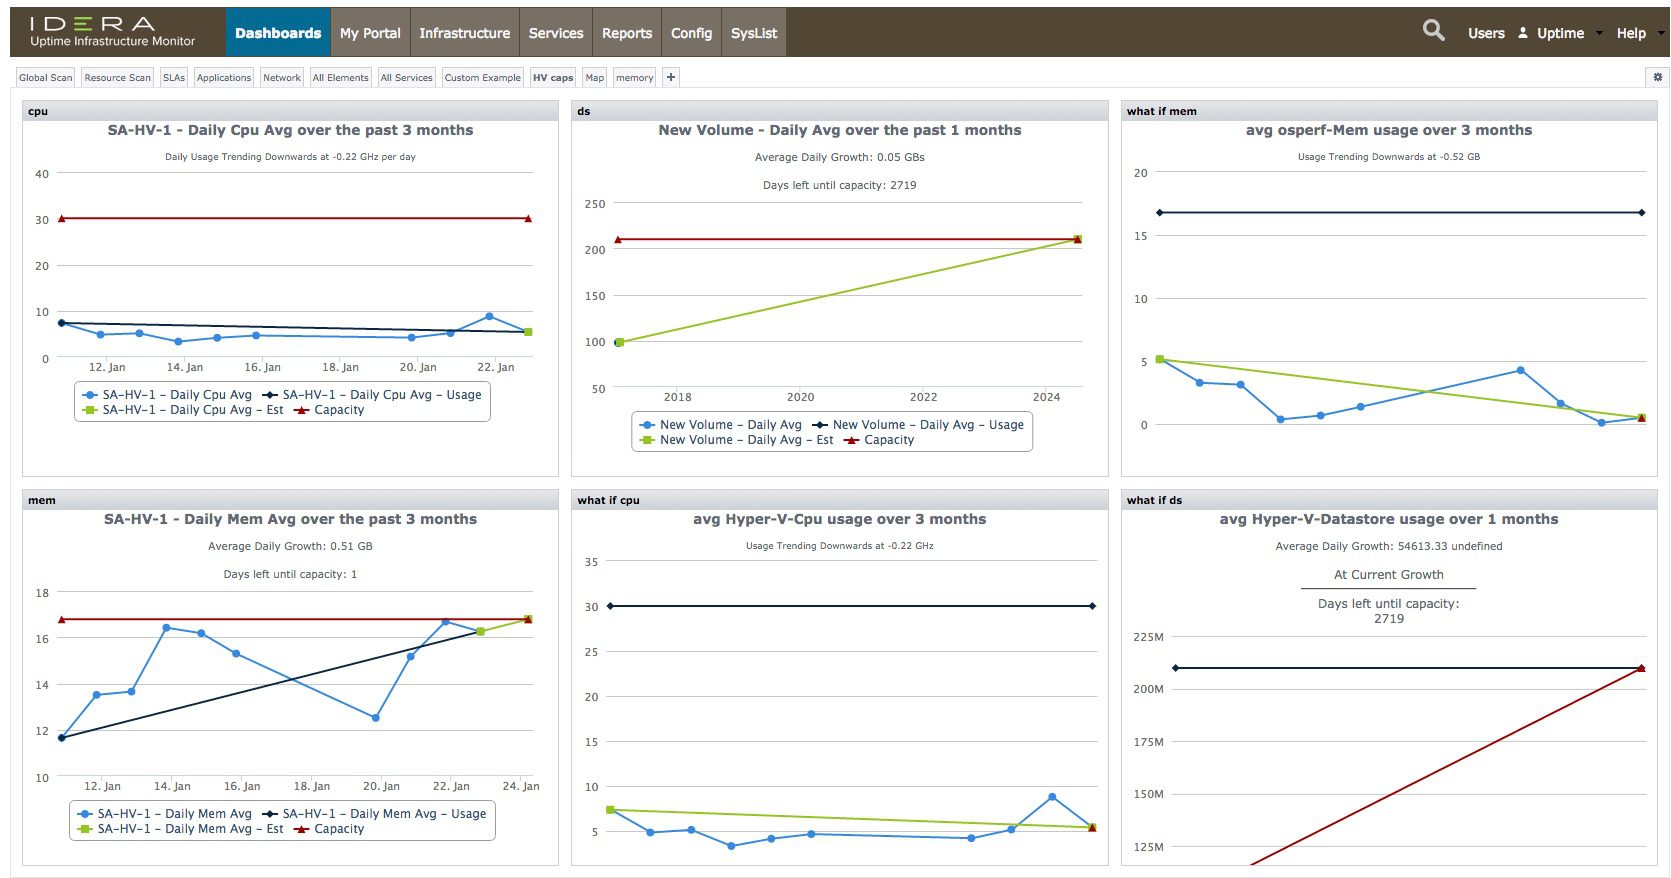
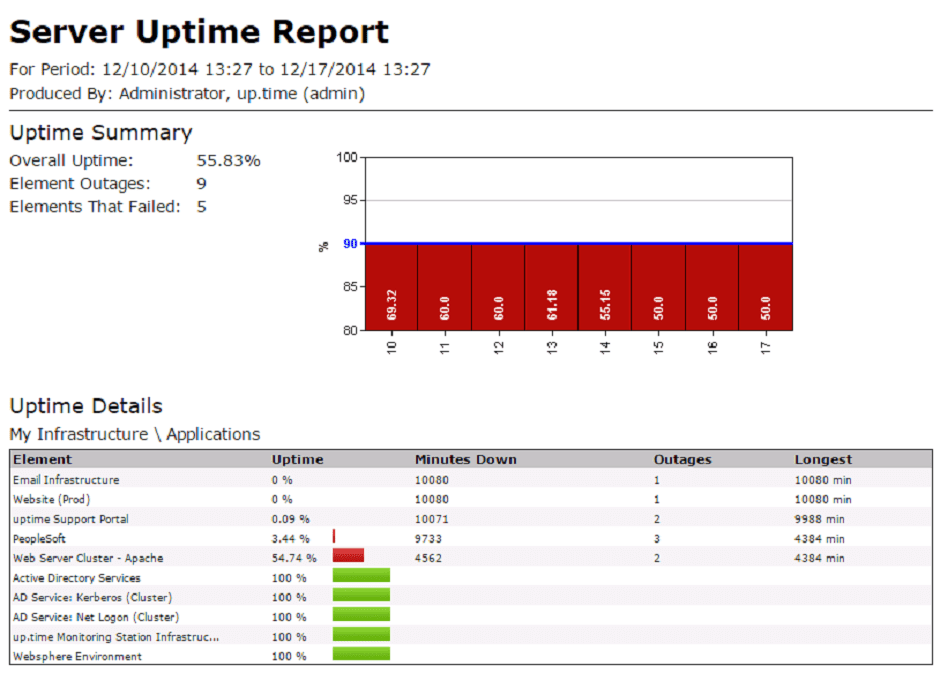
Server Performance and Availability
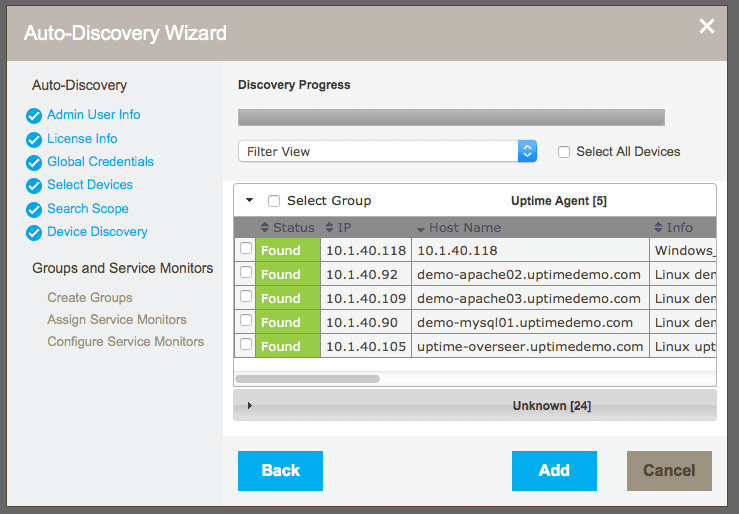
Find and fix problems fast with server uptime and hot spot reports, top ten problem lists, and more. Server reports show the overall uptime of the entire infrastructure, so you know if you’re meeting availability targets. For resource-constrained elements, find out if it’s a configuration issue or a resourcing issue. Show which servers and network devices are the top consumers in various resource usage categories (including CPU, Memory, Disk, and I/O). Show which physical servers or virtualization hosts are running short on memory, or are overworked and how that is trending into the future. Uptime Infrastructure Monitor provides both agentless (VMware, HyperV, Windows, XenServer, Novell, SNMP) and agent-based server monitoring for the flexibility you want.

Ready to Purchase?
Uptime Infrastructure Monitor is priced with value and simplicity in mind.