Purpose of this document
Due to its depth and potential for customization, there are often features of SQL Compliance Manager that are overlooked during the initial trial period. This document is designed to highlight areas that may be missed or that can be modified to give you more control over compliance and reporting in your SQL Server environment. For additional product information, visit the SQL Compliance Manager wiki page.
Introduction
IDERA SQL Compliance Manager is a secure, lightweight auditing and reporting solution for enterprise-level Microsoft SQL Server environments.
Why use SQL Compliance Manager?
- Track and manage SQL Server database compliance quickly and easily
- Audit servers, databases, and sensitive data to see who did what, when, where, and how
- Monitor and alert on suspicious activity to detect and track potential problems
- Satisfy audits with configurations and reports for multiple regulatory guideline requirements
- Reduce impact on audited servers via a lightweight data collection mechanism
- Web-based dashboard simplifies visibility and reporting for auditors and reviewers
Architecture
SQL Compliance Manager consists of a light, unobtrusive architecture that easily runs in your SQL Server environment with minimal configuration. All SQL CM components run outside and separate from SQL Server processes and SQL CM does not add to or modify any of your native SQL Server files or services.
SQL Compliance Manager provides a robust, easy-to-use SQL Server audit and reporting solution. Behind a friendly user interface, SQL CM offers a unique, loosely coupled architecture that is both flexible and extremely powerful. SQL CM fits your environment, no matter how simple or complex.
The following diagram illustrates the components of the SQL Compliance Manager architecture.
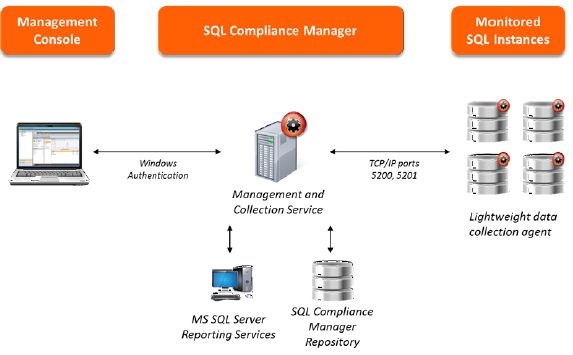
The Management Console is a centralized, intuitive user interface that allows you to easily and quickly modify audit settings, monitor events, and report on audit data. This user interface also provides the following information:
- Real-time status of audited SQL Server instances
- SQL Server login permissions
- Detailed logging of change activity
- Track and prove continual compliance using reports
The Collection Server processes audit data received through trace events, extended events (SQL Server 2012+), or audit logs (SQL Server 2017+) received from the SQL Compliance Agent, stores audit data in the events and archive databases, and sends audit setting updates to the SQL Compliance Agent.
The SQL Compliance Manager Repository is the central repository that tracks:
- SQL Compliance configurations, such as audit settings, server registrations, and console security
- Audited SQL Server events
- Alert messages
- SQL Compliance Agent activity
The SQL Compliance Agent gathers SQL Server audit data through trace events, extended events (SQL Server 2012+), or audit logs (SQL Server 2017+), caching these audited events in trace files. By default, the SQL Compliance Agent calls the Collection Server every five minutes to receive audit setting updates, and sends trace files for processing every two minutes. The SQL Compliance Agent runs under the SQL Compliance Agent Service account.
Software Requirements
Support for MS SQL Server software includes case-sensitive servers and databases. Support for Windows operating systems includes English and international versions. If an operating system service pack is not mentioned, a service pack is not required for that version of the operating system.
All SQL Compliance Manager 5.0 and later versions require at least .NET 4.0 components for the Management Console, Collection Server, and Data Repository; .NET 4.6.2 is recommended. .NET 3.5 is required for the Agent. Previous versions of SQL Compliance Manager require at least .NET 2.0. Sensitive Column auditing is supported by the SQL Compliance Agent 3.5 or later. To use this feature, please ensure you upgrade your agent to at least version 3.5.
You can install SQL Compliance Manager on a Windows 2008, 2012, or 2016 cluster.
The audited SQL Server computer should meet or exceed the software requirements recommended by Microsoft to run and manage SQL Server databases. Note that .NET 4.0 or later must be installed on the audited server.
In a clustered environment with virtual SQL Servers, the audited SQL Server is the virtual SQL Server. However, each node (physical computer) in the cluster that hosts the virtual SQL Server must meet or exceed these requirements.
Please refer to the current product documentation for the installation and deployment specifications for SQL Compliance Manager to obtain the supported OS and Microsoft SQL Server versions for the Management Console, Collection Server, Data Repository, and Agent.
Hardware Requirements
| Audited SQL Server | |
|---|---|
|
CPU
Memory
Hard Disk Space
|
1 GHz
512 MB
2 GB
|
| Collection SQL Server | |
|---|---|
|
CPU
Memory
Hard Disk Space
|
2 GHz
8 GB
20 GB for trace directory, 75 GB for repository
|
| Management Console | |
|---|---|
|
CPU
Memory
Hard Disk Space
|
1 GHz
512 MB
150 MB
|
Port Requirements
|
Collection Server
Computers hosting audited SQL Server Instances
|
Port 5201
Port 5200
|
SQL Compliance Manager Capabilities
SQL Compliance Manager audits each registered SQL Server instance and the associated databases according to the audit settings you configure. Your audit settings should directly correlate with the SQL events you need to track in order to meet your compliance objectives. For example, you can register a SQL Server instance for auditing but not audit the hosted databases. Likewise, you can audit a single database on a registered SQL Server instance that hosts multiple databases.
Registering your SQL Servers
Registering a SQL Server instance allows you to audit this instance and the associated databases. For each database you want to audit, register the corresponding SQL Server instance. When you register the instance, you can also deploy the SQL Compliance Agent to begin auditing SQL events on this instance.
To register your SQL Server instance:
- Ensure the SQL Server instance you want to register meets the hardware and software requirements.
- Decide which SQL Server events you want to audit on this instance.
- Start the Management Console, and then click New > Registered SQL Server.
- Specify or browse to the SQL Server instance you want to register with SQL Compliance Manager, and then click Next. You can also specify the description SQL Compliance Manager uses when listing this instance in the Management Console.
- If the SQL Server instance is hosted by a Microsoft SQL Server Cluster virtual server, select the checkbox. Click Next.
- Indicate whether you want to deploy the SQL Compliance Agent now or later, and then click Next. You can also choose to deploy the SQL Compliance Agent manually, allowing you to install the agent at the physical computer that is hosting the registered SQL Server instance.
- If you are auditing a virtual SQL Server or a SQL Server instance running in a non-trusted domain or workgroup, you must manually deploy the SQL Compliance Agent to the computer hosting the instance. For more information, see Deploy the SQL Compliance Agent manually.
- If you chose to deploy the SQL Compliance Agent now, specify the appropriate service account credentials for the agent, and then click Next. For more information, see Permissions requirements.
- If you chose to deploy the SQL Compliance Agent now, indicate whether you want the SQL Compliance Agent to use the default trace directory, and then click Next. By default, the trace directory path is:C:\Program Files\Idera\SQL Compliance\AgentTraceFiles
If you designate a different directory path, ensure the SQL Compliance Agent Service account has read and write privileges on the specified folder. - Select the server databases you want to audit, and then click Next. If you do not want to audit any databases, clear the Audit Databases check box.
- Select the collection level of server activities you want to audit, and then click Next.
- If you chose to create a custom audit collection, select the server activities you want to audit, and then click Next. You can also indicate whether you want to audit successful or failed access checks.
- If you chose to create a custom audit collection, specify which privileged users you want to audit, and then click Next. If you are auditing a virtual SQL Server or a SQL Server instance running in a non-trusted domain or workgroup, configure privileged user audit settings after you have deployed the SQL Compliance Agent.
- If you chose to create a custom audit collection, select the database activities you want to audit, and then click Next. You can also indicate whether you want to audit successful or failed access checks, capture SQL statements for DML and SELECT activity, or capture the transaction status for DML activity.
- If you chose to create a custom audit collection, specify which privileged users you want to audit, and then click Next.
- Specify whether you want to grant the assigned SQL logins read access to events audited on this SQL Server instance, and then Next. For more information, see How Console security works.
- Click Finish.
Use Event Alerts to Analyze Audit Data
You can use Event Alerts to identify any type of SQL Server event data you are currently auditing. Event Alerts allow you to track suspicious events collected in your audit data stream. You can use these aler ts to warn about potentially malicious activity or record routine activity on an audited instance or database.
For example, when a suspicious event is discovered, you can be notified by email so you can immediately diagnose and resolve the issue. You can also configure SQL Compliance Manager to write a custom message to the application event log so you have an ongoing record.
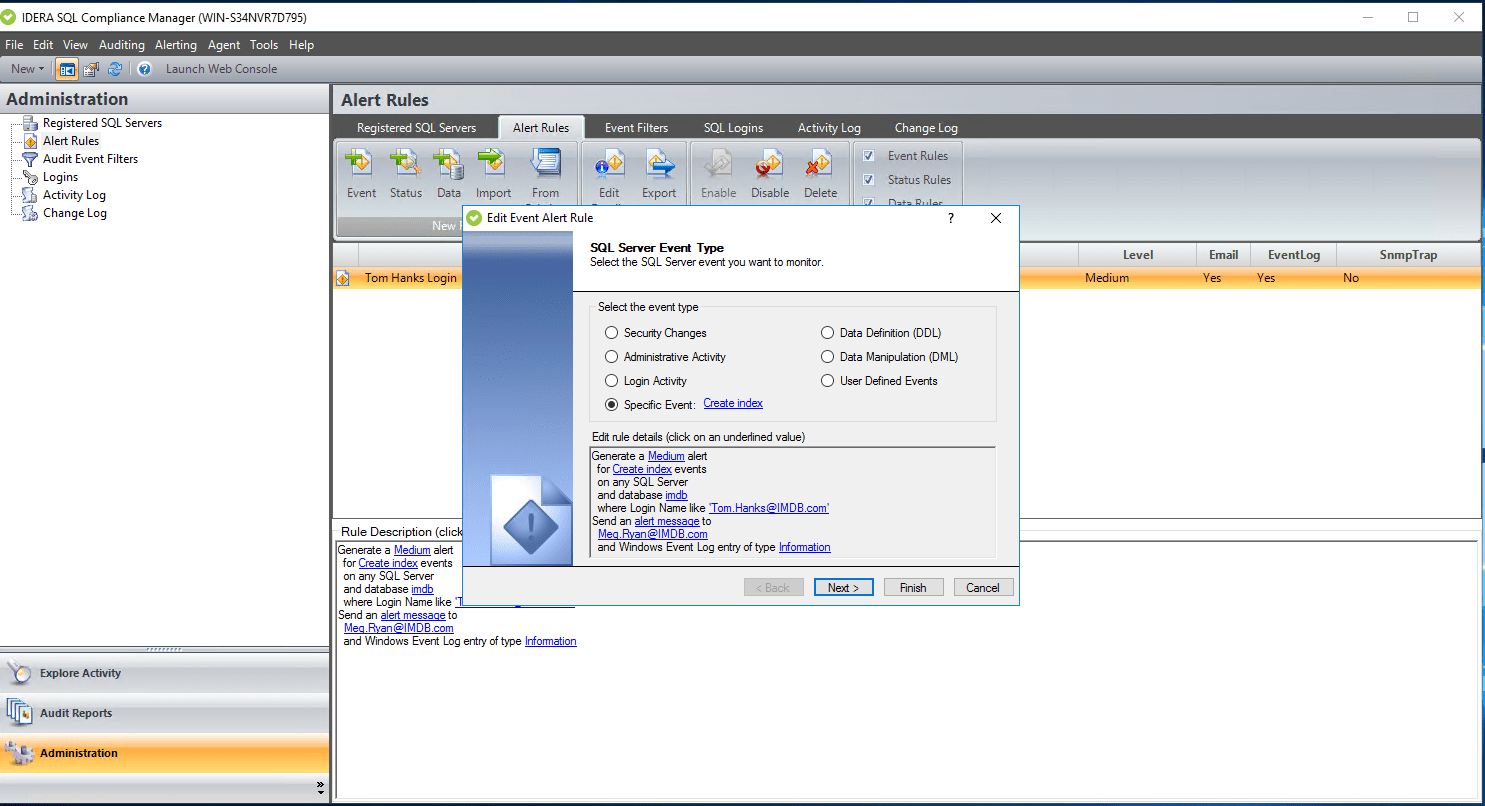
- Select Alert Rules in the Administration tree.
- Click Event on the New Rule ribbon.
- Select the type of event (event category) that you want to alert on, and then click Next.
- Select the type of object you want to alert on for the selected event type, and then click Next. By default, the alert rule will generate an alert when the selected event occurs on any registered SQL Server instance, database, or database object. Use the links provided on the rule details pane to narrow your alert rule to specific objects or objects that match a naming convention.
- Define the criteria under which the alert should trigger, and then click Next. Use the criteria to narrow your alert rule to generate alerts only under specific conditions. To specify values that the event should match, use the links provided on the rule details pane.
- Select the action you want SQL Compliance Manager to take when this alert triggers, and then click Next. To configure the email notification message or event log entry, use the links provided on the rule details pane.
- Specify a name and appropriate alert level for this alert, review the summary, and then click Finish.
Use Status Alerts to Ensure Compliance
You can use Status Alerts to identify issues and potential disruptions in your SQL Compliance Manager deployment. By enabling Status Alerts, you can:
- Confirm that your SQL Server instances are available to be audited.
- Ensure the SQL Compliance Agent and Collection Server are operating as expected.
- Proactively know when the event databases are growing too large so you can archive or groom your audit data before too much disk space has been consumed.
- Select Alert Rules in the Administration tree.
- Click Status on the New Rule ribbon.
- Select the type of SQL Compliance Manager status that you want to alert on.
- In the Edit rule details pane, define the criteria under which the alert should trigger, and then click Next.
- Select the action you want SQL Compliance Manager to take when this alert triggers, and then click Next. To configure the email notification message or event log entry, use the links provided on the rule details pane.
- Specify a name and appropriate alert level for this alert, review the summary, and then click Finish.
Use Data Alerts to perform forensics
You can use Data Alerts to track access to specific table columns that contain sensitive data, such as Social Security numbers. For example, when a user accesses a sensitive column, SQL Compliance Manager can notify you by email so you can immediately diagnose and resolve the issue. You can also configure SQL Compliance Manager to write a custom message to the application event log so you have an ongoing record.
- Select Alert Rules in the Administration tree.
- Click Data on the New Rule ribbon.
- On the Data Alert Type window, note that you are creating an alert for sensitive column access, and then click Next.
- Select the type of object you want to alert on, and then click Next. By default, the alert rule will generate an alert when the selected data is collected for an instance, database, table, or column. Use the links provided on the rule details pane to narrow your alert rule to specific objects or objects that match a naming convention.
- Select the action you want SQL Compliance Manager to take when this alert triggers, and then click Next. To configure the email notification message or event log entry, use the links provided on the rule details pane.
- Specify a name and appropriate alert level for this alert, review the summary, and then click Finish. By default, the new alert rule is enabled.
Use Report Cards to Track SQL Server Activity
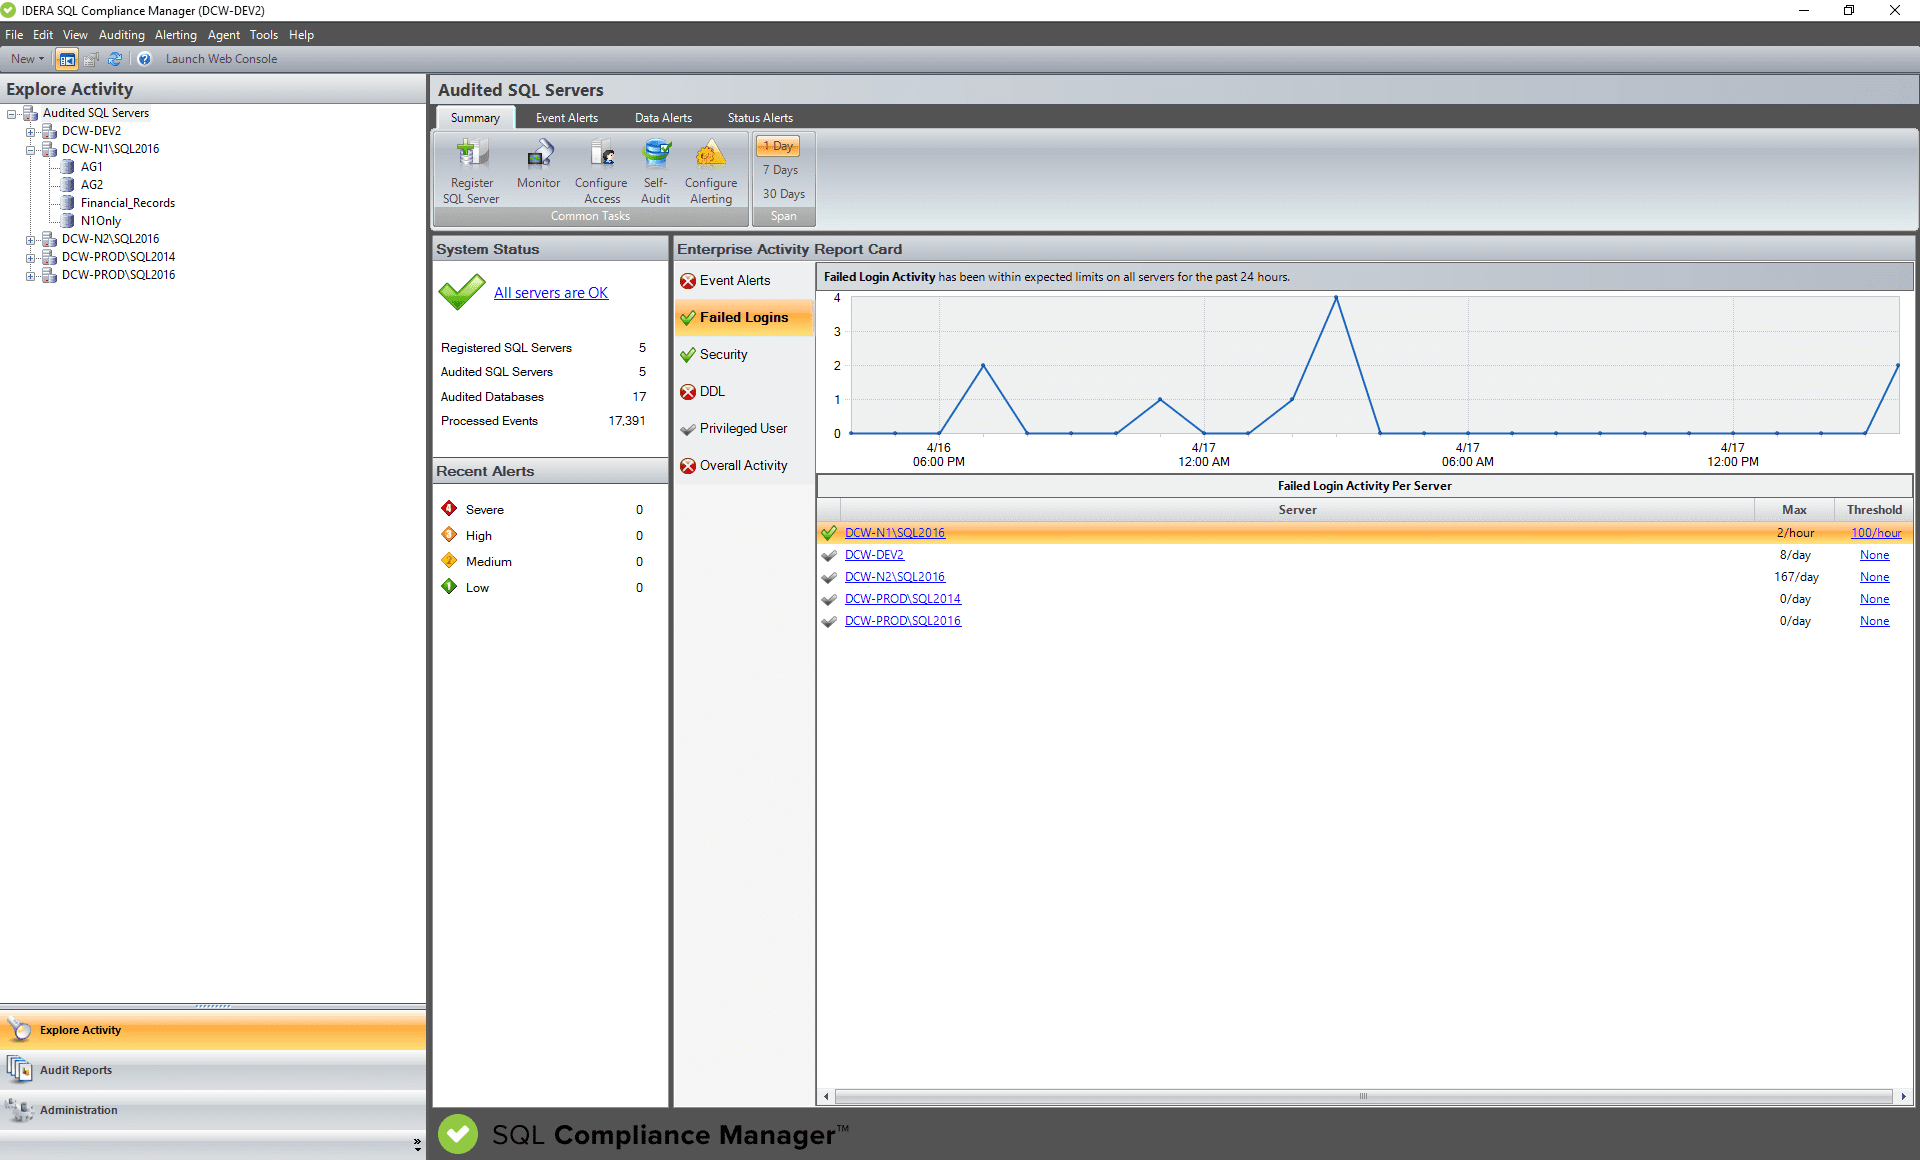
SQL Compliance Manager includes several Activity Report Cards that display up to 30 days of SQL Server activity. Activity Report Cards allow you to view the SQL Server activity at the enterprise and individual SQL Server instance levels. These report cards allow you to quickly check activity in each event category audited, view SQL Server activity statistics, and short-term activity trends. Activity Report Cards can be used to identify problems that might require more in-depth analysis.
- Select Audited SQL Servers from the Explore Activity tree to see the Enterprise Activity Report Card. The Enterprise Activity Report Card allows you to review the status of your audited SQL Servers and the recent activity that has occurred on them.
- Select any SQL Server instance from the Explore Activity tree to see the Server Activity Report Card. The Server Activity Report Card allows you to review the activity status and recent audit event history on your SQL Server instance.
- Select any database from the Explore Activity tree to see Recent Database Activity Summary. The Recent Database Activity Summary allows you to review the recent database activity and a listing of recent audit events that have occurred on the selected database.
Report on Audit Data
SQL Compliance Manager Reports provides several built-in reports that allow you to quickly and easily meet the demands of on-the-spot audits, routine audits, and long-term event trending. Each report gives detailed information about events in your SQL Server environment. You can use SQL Compliance Manager Reports to track compliance on demand and provide self-service reporting to third-party auditors.
The following report categories are included with SQL Compliance Manager. The activity, change, and history reports list events that passed the SQL Server access check. To audit events that failed the SQL Server access check, generate the Permission Denied Activity report for the appropriate SQL Server instance.
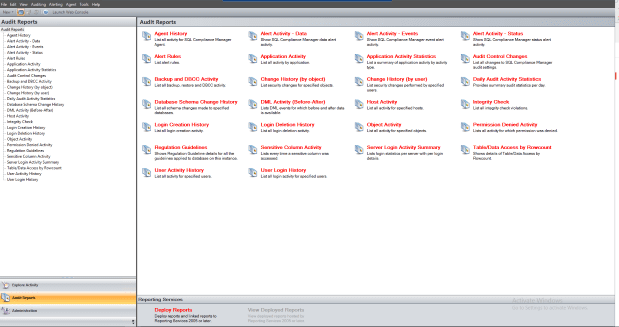
The Daily Audit Activity Statistics report lists the amount of activity that occurred on the SQL Server instance or designated database, on an hourly basis, for the dates specified. Use this report to audit overall activity levels on your SQL Server instances and databases.
The Alert Activity report lists alert details, such as target object, event, and time of the alert. Use this report to audit alerts triggered over a specified time period.
These reports list activity details, such as login, event, and time of activity, per application and database. Use these reports to audit activity across multiple applications and databases.
The Backup and DBCC Activity report lists backup, restore, DBCC, and database object activities on specific databases. Use these reports to audit mass data movement or database object activity, such as SELECT or UPDATE, across multiple databases.
The Database Schema Change History report lists schema changes applied to audited databases. Use these reports to audit data definition language (DDL) statements, such as dropped tables, executed against one or more databases on a SQL Server instance.
The DML Activity (Before-After) report lists DML events for which before and after data is available. Use this report to audit UPDATE, INSERT, and DELETE activity on critical or sensitive databases.
The Host Activity report lists all host computers from which specific logins executed an action. Use this report to audit user behavior from multiple client computers, identifying the host computer from which an activity request originated.
These reports list changes and updates applied to the SQL Compliance Agent deployed on a specific SQL Server, and any integrity violations in your audit data. Use these reports to diagnose audit data integrity issues and track agent configuration changes as well as agent activities, such as SQL Compliance Agent service restarts.
The Regulation Guidelines report lists all of the regulations and their individual guidelines applied to one or more databases. Use this report to audit the regulatory guidelines applied to your SQL Server instance.
These reports list permission changes by object type as well as unauthorized attempts to execute activities. Use these reports to audit your SQL Server security settings and identify misconduct.
The Sensitive Column report lists all SELECT events that were initiated by applications to read specific columns that contain sensitive data. This report also includes the T-SQL statements that executed the corresponding commands. Use this report to audit columns that require high security, such as employee Social Security numbers (SSNs).
These reports list user activities performed on a specific SQL Server instance, and provide a history of login creations and deletions. Use these reports to audit user behavior and login management.
You can customize any of the integrated audit reports or develop new reports that fit your unique auditing needs. First, deploy the SQL Compliance Manager Reports to your existing Microsoft Reporting Services. Then select which reports you want to customize from the corresponding RDL files (by default, these files are stored in the Anytime folder under the SQL Compliance Manager Reports root folder on the Report Server).
- Save your new and modified reports to a separate folder
- Use a different filename for modified reports
Manage Audit Data
You can optimize auditing performance and preserve your compliance history through SQL Compliance Manager archives. Archiving allows you to off-load collected and processed events from the Repository databases to an archive database. Your audit data remains available for reporting and viewing without impacting your collection and processing performance. To view or report on archived events, simply attach the archive database.
If your environment requires more aggressive data management, consider implementing a maintenance plan for your archive databases to meet your storage and performance needs. Consider using tools such as IDERA SQL Safe Backup to quickly and securely back up archive databases so that you maintain optimal performance on the host SQL Server instance. Also consider grooming older event data. You can groom audited events from selected archive databases using the Management Console.
When you archive your registered SQL Server instances, SQL Compliance Manager moves audited events from the Repository databases to an archive database. You can archive event data for all registered SQL Server instances or a particular SQL Server instance.
You can archive events using the Management Console or the Command Line Interface. Note that SQL Compliance Manager does not automatically shrink the Repository databases after an archive is performed. After each archive operation, re-index and shrink the corresponding event databases in the Repository so that SQL Server can reclaim the space that had been allocated due to the previous growth.
When you archive events using the Management Console, SQL Compliance Manager can also perform the following actions:
- Check the integrity of the collected events to ensure you are archiving uncompromised data. If the audit data for the selected SQL Server instance fails this integrity check, SQL Compliance Manager does not archive the data.
- Log the event in the Change Log.
- Set your archive preferences. To set archive preferences, click Auditing on the menu bar, and then select Archive and Retention > Archive Preferences.
- Click Auditing on the menu bar, and then select Archive and Retention > Archive Audit Data Now.
- Choose whether you want to archive events for all registered instances. You can select a specific SQL Server instance.
- To generate a CLI command that uses your archival preferences, click Generate Script. From the View Script window, you can save the command as a batch file or copy the command to another application.
- To archive your audit data now, click OK.
Groom Audit Data
You can groom audited SQL events from the event databases in the Repository. When you groom audit data, SQL Compliance Manager deletes all events that are older than the age (in days) you specify. You can groom audit data collected from all registered SQL Server instances or from selected instances. Grooming ensures the Repository contains only the audit data you need.
When you groom events using the Management Console, SQL Compliance Manager also performs the following actions:
- Checks the integrity of the collected events to ensure you are grooming uncompromised data. If the audit data for the selected SQL Server instance fails this integrity check, SQL Compliance Manager does not groom the data.
- Logs the event in the Change Log.
- Click Auditing on the menu bar, and then select Archive and Retention > Groom Audit Data Now.
- Specify the appropriate settings, and then click OK.
