















SQL Diagnostic Manager Product Updates
Your single source for release news, feature spotlights, and learning resources for SQL Diagnostic Manager
Feature Spotlight: Session Monitoring
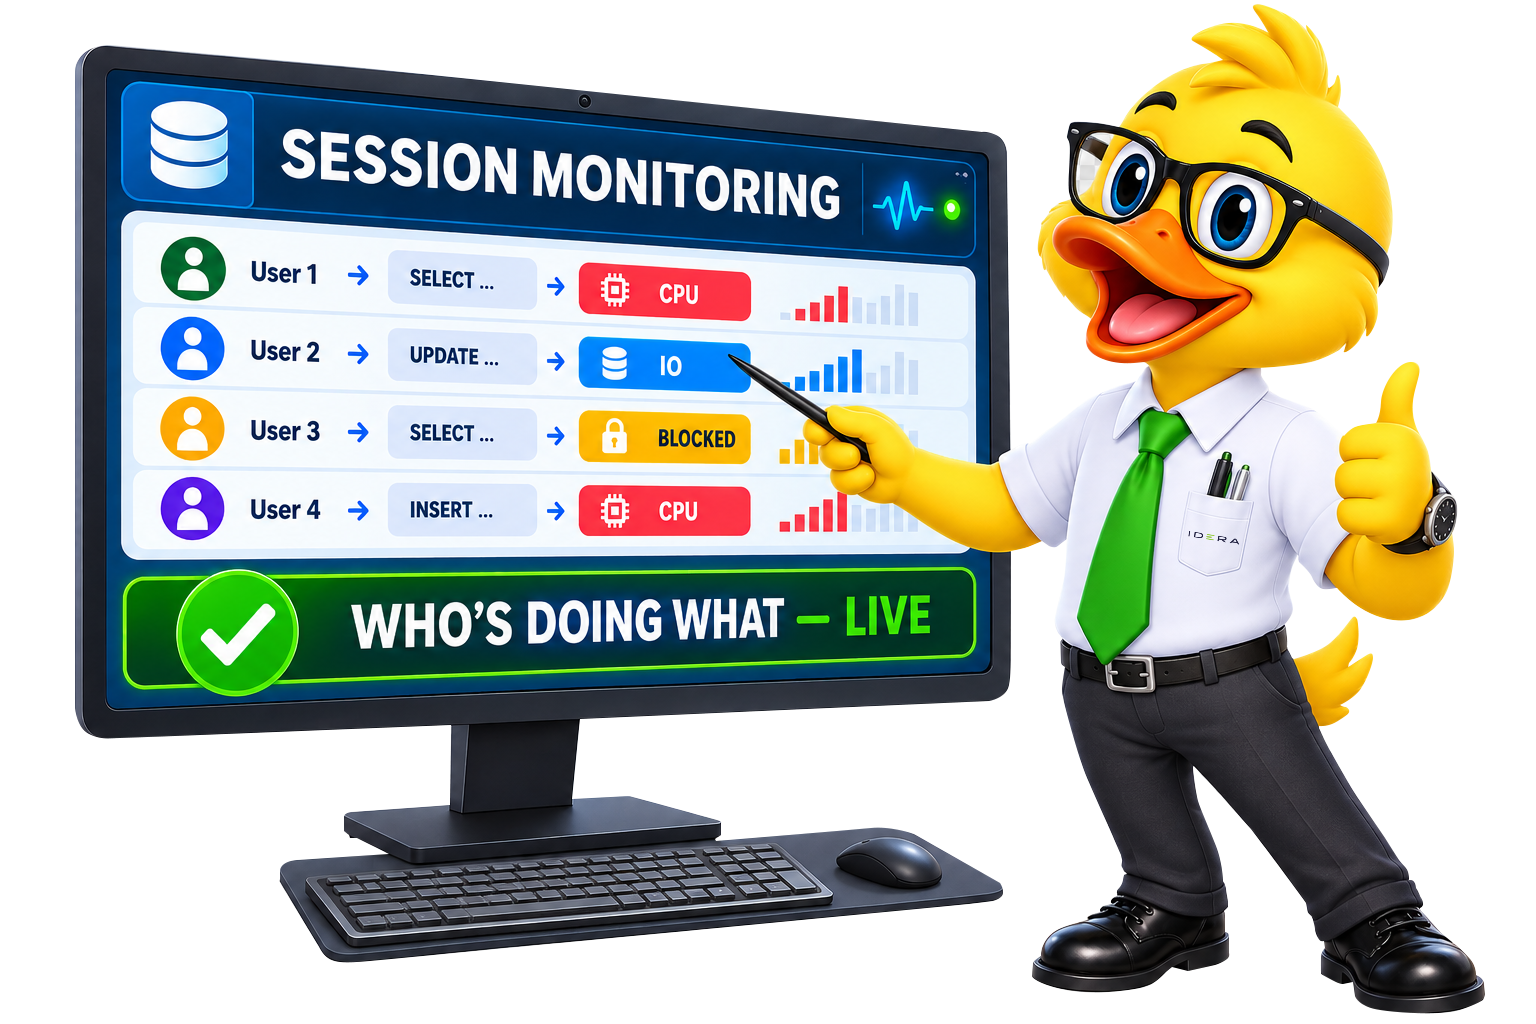
SQL Diagnostic Manager already has a live window into exactly what’s happening on your SQL Server instances right now — most teams only reach for it when something’s already on fire. Session Monitoring gives you a real-time view of every active connection, running query, and resource consumer, including blocking chains as they form, so you can identify what’s causing a slowdown while it’s still happening instead of reconstructing it from logs after the fact. We’ve put together a blog post and a step-by-step setup guide to help you get the most out of it.
Check out other recent announcements
Feature Spotlight: Forecasting & Capacity Planning
SQL Diagnostic Manager already has the data to tell you where your storage is headed — most teams just aren't looking at it yet. Disk Space Usage Forecast tracks historical disk growth trends and projects them forward, using linear or exponential forecasting to match how each workload actually grows, so you can catch a shortfall weeks or months out instead of at 2 a.m. We've put together a blog post and a step-by-step setup guide to help you get it working fast.
Feature Spotlight: Baseline & Dynamic Thresholds
SQL Diagnostic Manager already has everything it needs to learn what "normal" looks like for each of your SQL Server instances; most teams just haven't turned it on yet. Baseline & Dynamic Thresholds automatically adjusts alert thresholds per server, per time of day, so your alerts fire on real problems instead of expected load. We've put together a practical setup guide and a deep-dive workflow walkthrough to help you get there fast.
Feature Spotlight: Alert Actions & Automated Responses
SQL Diagnostic Manager is already firing the alerts; most teams just haven't configured what happens next. Alert Actions & Automated Responses lets you wire a response directly to any threshold breach: email the right person, run a remediation script, kick off a SQL Agent Job, open a ServiceNow ticket, or send an SNMP trap, scoped per metric, per server, or across your entire environment. We've put together a blog post and a step-by-step setup guide to help you get your first rule running today.
Welcome to the SQL Diagnostic Manager In-Product Notification Center
Introducing the SQL Diagnostic Manager Product Update Center—releases, tips, feature spotlights, and learning labs in one place to boost performance fast.
What’s New in SQL Diagnostic Manager 14.0
New in SQL Diagnostic Manager 14.0: AI-powered query and workload index optimization built into Query Monitor—turn slow queries into workload-aware index recommendations in minutes, not days. Get actionable tuning guidance you control (nothing is auto-applied), so you can resolve performance issues faster with less guesswork.
Try 3 Powerful New Free AI Tools to Support SQL Diagnostic Manager
Turn SQL Diagnostic Manager insights into fixes faster with IDERA’s free AI tools—generate, optimize, and validate SQL in minutes.
Don’t miss out:
Follow Us on Linkedin
Subscribe to our LinkedIn newsletter
Learn more about other IDERA SQL tools
SQL Compliance Manager
Fast configuration of regulatory and audit compliance settings with proactive monitoring, alerts and reporting.
SQL Secure
Automated dB security, monitoring and management for MS SQL, Azure, and Amazon RDS for SQL server
SQL Safe Backup
Backup & instant recovery for SQL Server, Azure Blob Storage and Amazon S3