Free Tool – SQL Check
Database Performance Monitoring for SQL Server, Azure SQL Database, and Amazon RDS for SQL Server
Watch key performance metrics in real-time
Ultimately, it supports informed, data-driven decision-making to optimize system resources, improve user experience, and minimize downtime, thus contributing to an organization’s productivity and success.
Download the free tool SQL Check now!
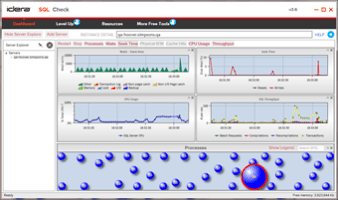
Monitor in real-time database performance with an intuitive and customizable dashboard.
Identify issues by displaying key metrics in time series charts.
Discover the bottlenecks that slow down your performance.
Resolve problems fast by drilling down into details for quick diagnostics.
Deploy the free tool without installing anything on the monitored database instances.
The release of SQL Check version 3.7 in 2024 focuses on addressing numerous customers submitted suggestions and adding quality enhancements to the application:
Connecting to instances via Azure Active Directory to supplement SQL Authentication and Windows Active Directory
Displaying the graphical user interface properly at different screen sizes and for all high resolution monitors
Better usability of the application by refining and reinforcing its overall functionality
Bug fixes
Tech Specs
- Microsoft Windows: Server 2008 SP3, 7 post-SP1 with .NET 4.0, Server 2008 R2, 8, Server 2012, 8.1, Server 2012 R2, 10, Server 2016, Server 2019; plus 11, Server 2022 (provisional); 64-bit, 32-bit
- Microsoft .NET Framework: 4.0 and later
- web browser: Microsoft Internet Explorer 10.x+ (minimum of Windows 7 SP1, Server 2008 R2 SP1), Microsoft Edge, Google Chrome, Mozilla Firefox
Database Platforms
- Microsoft SQL Server: 2008 R2, 2012, 2014; 2016, 2017, 2019; plus 2022 (provisional); Windows, Linux; Express, Standard, Enterprise editions
Databases in the Cloud
- Microsoft Azure: Virtual Machine (VM), SQL Database
- Amazon Web Services: Elastic Compute Cloud (EC2), Relational Database Service (RDS)
- connection: DNS domain name, IP address; SQL Authentication, Windows Active Directory, Azure Active Directory
Agentless
- SQL Check does not install any components, dynamic link libraries (DLLs), scripts, stored procedures, or tables on the monitored database instances.
Comparison With SQL Diagnostic Manager
| SQL Check | SQL Diagnostic Manager | |
|---|---|---|
| Real-time monitoring of key SQL Server performance metrics | 20 metrics | 230 metrics |
| Number of servers monitored | 1 server | Up to 300 servers |
| No agent installation required | ||
| Central management console | ||
| SQLdm mobile for remote monitoring from mobile devices | ||
| Multiple views of monitoring data | ||
| Comprehensive real-time alerting | ||
| Extensible monitoring by defining any WMI or SQL counter | ||
| Identification of and alerting on locking and blocking processes | ||
| Identification of worst-performing code (Stored Procedures, SQL statements, Queries, etc) for performance tuning | ||
| Central repository of historical data | ||
| Historical trend analysis | ||
| Comprehensive reporting | ||
| Support materials and documentation on IDERA website and community site | ||
| 24/7 support via comprehensive support site, email, live chat and live phone assistance | ||
| Evaluation copies available | N/A | Yes, free for 14 days |
| Download Now | Start for FREE |
Monitor Key Performance Metrics
Connect to a SQL Server instance and display the most important metrics for performance in dedicated charts on a
convenient dashboard. Hover over the displayed data to view details.
See Throughput of Varying Types
Display important metrics such as wait stats, reads, writes, session details, and cache hits. Check out what happens in
batches, compilations, recompilations, and transactions so you do not experience any surprises and know where to direct
your attention to prevent potential issues.
See Heartbeat Statistics at Different Intervals
Monitor the performance like a heart rate monitor for your SQL Server environment. Customize the refresh rate and amount
of historical data for each SQL Server instance.
Get Up and Running in Minutes
Quickly get up and running within minutes using the setup wizard to guide you through the install process. With the
intuitive graphical user interface of the application, easily register SQL Server instances and start displaying
real-time metrics.
No Agents Required on Monitored Instances
Installing agents on SQL Server instances can be tedious and invasive. And agents installed on monitored SQL Server
instances can impact performance. SQL Check does not require installing an agent on the monitored instances.
Connect to the Cloud and Run in the Cloud
Connect to database instances hosted on cloud virtual machines, such as SQL Server on Azure Virtual Machine (VM) and SQL
Server on Amazon Elastic Compute Cloud (EC2).
Connect to the managed cloud databases Azure SQL Database and Amazon Relational Database Service (RDS) for SQL Server.
Install and run on virtual machines hosted in the cloud, such as Windows on Azure Virtual Machine (VM) and Windows on
Amazon Elastic Compute Cloud (EC2).
