Video : SQL Diagnostic Manager for MySQL
Introduction
SQL Diagnostic Manager for MySQL is considered better than its competition because of its simplicity, ease of use, agent-less installation, and customizability. Users appreciate these features and find them to be an advantage over other monitoring systems.
SQL Diagnostic Manager for MySQL offers several advantages for MySQL database monitoring and management, including:
Watch this video for an introduction to SQL Diagnostic Manager for MySQL
Transcript
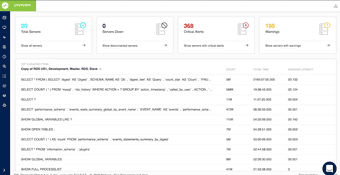
Hello everyone. Today, I will be presenting a quick walkthrough of Monyog. Now, before we start. Let us first talk about what Monyog is. Monyog is an agentless on-premise MySQL and MariaDB monitoring solution that gets up and running within two minutes. Now it is a cloud release solution. And works well with all the flavors of standard and my and hosted MySQL. With Monyog you can monitor your critical databases confidently rather than hunting and pecking for speed with other monitoring solutions. Now the moment you launch Monyog it takes you to the overview page. As you can see here. Which gives you the full capture performance visibility across the databases. You get to see the total number of servers that you have registered with Monyog. In case any of these servers are down. What are the critical alerts and warnings associated with each of these servers? And also you get to see the top ten running queries based on total execution time. But just a single click of a button. You get to see the relevant query details. So, all in all, it basically, all this information allows you to avoid the visibility gap. And actually enables you to achieve faster issue resolution time. Next up we have the server space. Now the server space basically allows you to see the total number of servers that you have registered with Monyog. One interesting feature that can be accessed by the service page is the disconfirmation feature. Now suppose if you are trying to do it this cleanup exercise. You can click on a particular server. And just go to the disconfirmation feature, which lets you drill down to read it database level. Here you can uncover which database is taking most of your space. What is the total data size? What is the total size of a particular database? If there is too much of indexing here or not. So all this information is presented to you in a tabular format. Which helps you uncover the information required to do is this cleanup exercise. Now one interesting thing to see here is that if you would like to do. If you would like to drill down even further. Monyog allows you to do that with just a single click of a button […]. You cannot let Monyog would let you drill down up to the table level. Now here again you can uncover the critical information required for you to figure out the top candidates for cleanup. Moving forward. We have the dashboard feature. Now, this is one of the most loved features of Monyog as it has all the charts that indicates the health of your MySQL environment. Any spike in these charts can be a good indicator of bad performance. You can look into these pipes and figure and see the relevant queries that were running at that point of time. This helps immensely when you are trying to look for the culprit query causing the issue. Now, this does not end here. What I am excited to show you guys here is the capability for our customers to roll out their own custom dashboards. So all you need to do is click on Create New Dashboards. Select the parameters that you would like to see in a particular chart. You just have to enable them and click on Save. Now the reason that (we allow) we provide this flexibility to all I users is because we believed one size does not fit all. And a lot of users they would like to do a lot of charting and trending for a lot of matrices. So if you are someone who is trying to customize the environment which would suit their needs all you need to do is roll out your own charts. That would figure help you figure out the health of your MySQL environment. Moving forward. We have the monitor space. Now Monyog gets shipped with more than 600 plus best practices monitors and advisors. And now the moment we install Monyog and point these monitors towards your servers. It starts monitoring your critical MySQL service. And provides you timely alerts and advisers before things go wrong. Now, these monitors are not just simple plugins. We have business partners like MariaDB who deploy Monyog in the field. And while doing so they keep sending feedback based on their experience. And that basically helps us to constantly update and add new advisors. And Monyog testimonial. The best part about these monitors is that the underlying logic or code is not hidden from our customers. Everything is visible to you. As you can see here. And if you are someone who would like to customize these monitors. They give our users the flexibility to do that as well. Since the underlying code is not hidden. You can customize a particular monitor to your heart’s content. Great. So moving forward. We have the real-time monitoring feature. Now, this again is one of the most loved features of Monyog. Because real-time monitoring is what you need if when you want to see what is happening to your servers in real-time. I will just load a safe session here to demonstrate the matrix that real-time collects. Now real-time continuously execute a bunch of queries on your servers and fetches information. As you can see here. What are the top queries running at real-time. What are the most busiest database tables? What are the slow query logs for the particular real-time session? What are the log tables locking queries? And things like that. Since this information is retrieved in real-time you get to see what your servers are up to at any point in time. Now a real a particularly real-time session can also be stopped and saved for later analysis. Moving forward. We have the query analyzer feature. Now it is one of the most powerful features of Monyog. Because it lets you capture queries using multiple endpoints. You can capture queries either by analyzing the slow query log, the general query log, or the sniffer. Here is how the information layout looks like. You get to see the top five running queries based on the total execution time. Now if you want to do a non-obtrusive query analysis. We have something unique which we call this new feature. I will just let the data load up. Now basically what sniffer does is it takes a dump of the full process list every single second. And store it in our repository. Which allows you to later run reports on that particular information, clean up literals, and group queries. So this information is a game gap gathered by retrieving all the queries that is hitting your MySQL environment. Now the query and my analyzers feature easily uncovers the problematic query so you can focus on queries that yields the highest value rather than shooting in the dark and waiting for the database performance to go horribly low. Alright, moving forward. We have the audit log feature. Now in recent years, there has been a mock need for more sophisticated tools. Due to the increase of internal and external security and auditing policies. Now both MariaDB and MySQL implement auditing by native plugins. Now, these are fully configurable. And main core database activities in a variety of formats. The resulting log file. When you click on Show Audit Log may be read directly. Or analyzed by a tool such as Monyog. Now, what once you analyze the audit log. It provides you a summary of the failed logins. What are the field events, the schema changes, the data changes, and restore procedures? And not only that. It also lets you view the fields such as the user name, host operation, databases, table, queries, and things like that. All within an easy-to-read table of formats. So if you are someone who has a big bigger DBA [database administrator] team. And they would like to analyze an audit. All the activities happening in your MySQL environment. You can use the audit log feature to track these activities. Moving forward. We have the top track configuration feature. Now Monyog all also gives you the option to track and compare server configuration with Monyog. Now, this is pretty unique […] you can. No other monitoring tool in the market is currently doing this. If you have a set. I will give you an example. If you have a set of servers that are of different versions and some servers have performance problems. Because could be the difference in the configuration of these. So now using Monyog you can see a side-by-side difference in the configuration of service with a single flag. As you can see there is it on the top right corner. There is a button called Show Only Change Values. So with just a single click of a button. You can see a side-by-side difference in the configuration of servers. You can also track the configuration changes over a specific time range to see. When did the change occur? And was it expected or not? All you need to do is toggle between from compared to track and you get to see the information. Such as. What was the latest configuration case? At what time and when was the confrontation changed initially. What was my oldest configuration change? And what were my latest configuration changes? Now moving forward. We have the application overview. Now the reputation evolving feature basically allows you to view the application hierarchy of your servers along with details of each replicated server. To make sure that the data is always up-to-date at any point of time. You can switch from a graphical to […] application view. To get a deep dive into the running servers. So this brings us to the end of this session. Last but not least. If you need the complete MySQL monitoring system with all the warning mechanisms. And is tired of using expensive unreliable monitoring tools. Download a free trial of Monyog today. We promise that you will never look back. Thank you for having me. And have a good one.
See Also:
- Webcast: What’s New in SQL Diagnostic Manager for MySQL 8.9
- Datasheet: Monitor MySQL Performance with SQL Diagnostic Manager for MySQL
- Datasheet: Monitor SQL Server Performance with SQL Diagnostic Manager for SQL Server
- Datasheet: SQL Diagnostic Manager for MySQL
- Video: An Overview of SQL Diagnostic Manager for MySQL
- Video: Why Use SQL Diagnostic Manager for MySQL
- Video: Achieve Faster Issue Resolution Time for MySQL and MariaDB with SQL Diagnostic Manager
- Video: Audit Log Analysis for MySQL and MariaDB Databases with SQL Diagnostic Manager
- Video: Become Better at Monitoring MySQL and MariaDB Databases with SQL Diagnostic Manager
- Video: High Availability and Scalability with Galera Cluster for MySQL
- Video: Monitoring Amazon RDS for MySQL and MariaDB with SQL Diagnostic Manager: Beyond Raw Logs
- Video: MySQL Performance Tuning with SQL Diagnostic Manager
- Video: MySQL Performance Tuning with SQL Diagnostic Manager – Part 1 of 4
- Video: MySQL Performance Tuning with SQL Diagnostic Manager – Part 2 of 4
- Video: MySQL Performance Tuning with SQL Diagnostic Manager – Part 3 of 4
- Video: MySQL Performance Tuning with SQL Diagnostic Manager – Part 4 of 4
- Video: Real-time MySQL Monitoring and RDS File-based Log Monitoring with SQL Diagnostic Manager
Topics : Database Diagnostics,Database Monitoring,Database Performance,SQL Query Performance,
Products : SQL Diagnostic Manager for MySQL,